Questions & analysis
Measuring employee satisfaction: Which questions help?
Employee satisfaction can be captured through clearly worded questions about defined working conditions and a transparent analysis. To track changes over time, the wording, response scale and reference period must remain sufficiently comparable. A single average describes responses but explains neither their causes nor the company's overall situation.
Before building a questionnaire, clarify the decision: Do you want a broad overview, to understand a specific problem area or to track an action already implemented? The scope, frequency and analysis depend on this. Without that clarity, it is easy to end up with a collection of interesting values that does not suggest a next step.
The following questions are original wording examples for practical use. They are not a validated measurement instrument or a guide to assessing individuals.
What do we want the measurement to help us decide?
First, complete a sentence: ‘After the survey, we want to decide whether …’ For example, whether task allocation needs to be clarified again or whether a recently introduced priorities meeting should continue. A decision like this limits the survey and helps you choose suitable questions.
A general satisfaction question can provide an overview. For a decision about a specific action, you usually need a question closer to the problem. If disruptive interruptions are the issue, an assessment of the ability to work with concentration is more useful than a question about all working conditions.
A more comprehensive assessment and a short recurring check-in serve different purposes. The article Check-in or annual survey helps you choose a format. You do not need to ask about every topic in every round.
Which questions are suitable for an initial questionnaire?
Ask about one clear subject at a time. Avoid wording that asks about several things at once. Someone who is satisfied with leadership but not with the tools cannot give an unambiguous answer to ‘Leadership and equipment are good’.
| Subject | Original example wording | What the response does not explain |
|---|---|---|
| Overall assessment | ‘How satisfied are you with your working conditions overall at the moment?’ | Which specific condition is decisive for that assessment. |
| Priorities | ‘I know which tasks take priority this week.’ | Whether those priorities are the right ones for the business. |
| Support | ‘When I encounter difficulties in my work, I know who to turn to.’ | Whether the support is sufficient in every case. |
| Work organisation | ‘Our agreements help me carry out my tasks.’ | Which individual process should be changed. |
| Development | ‘I have opportunities to develop the skills I need for my tasks.’ | Whether a particular training activity was effective. |
The examples are a selection to draw on, not a mandatory questionnaire to use in full. Choose only what fits your purpose. An overall assessment and several specific statements should not be combined into an overall index without a reasoned measurement concept.
The GESIS guidance on question wording explains why clear wording and an unambiguously defined subject are important. Beforehand, ask a few suitable people to explain in their own words what they understand your questions to mean.
How do we use a scale from one to five meaningfully?
First, decide what kind of response you expect. A satisfaction question needs a satisfaction scale. A statement such as ‘I know the priorities’ can be answered with a level of agreement. Do not use the same labels for different meanings.
For an agreement scale, you might label the endpoints ‘Strongly disagree’ and ‘Strongly agree’, for example. Explain the chosen format consistently. Also consider how people should respond when they cannot assess the subject. A neutral midpoint must not silently also mean ‘don't know’.
The GESIS guideline on rating scales covers response categories and labelling, among other things. For your use, it is particularly important not to change the format casually during a comparison series. A change in scale can create an apparent trend that is actually due to the change in data collection.
What does an average tell us, and what does it hide?
An average summarises numerical responses. It can make an overview easier, but hides the distribution. In a purely numerical example, five ratings of three give the same average as the values one, one, three, five and five. In the first case, the responses are uniform; in the second, they vary widely.
The analysis should therefore also consider the number and distribution of responses, as far as data protection and the method used allow. The average alone does not show whether an issue affects everyone similarly. In small groups, however, additional detailed analyses can allow individuals to be identified. Responsible limits then matter more than maximum detail.
The numbers in a response format are not exact physical measurements, either. An increase from three to four does not automatically mean ‘one third more satisfaction’. Avoid percentage interpretations of this kind. First describe which responses have changed and under what conditions.
How do we handle missing responses?
Check how many people were able to participate and how many valid ratings are available for each question. The number of completed questionnaires can differ from the number of numerical responses, for example because questions were skipped or answered with ‘Cannot assess’.
Missing responses do not mean agreement. They can be related to leave, access problems, lack of time, unclear questions or lack of trust. Non-response alone does not establish a clear cause. Ask about obstacles in the participation process without putting pressure on individuals.
The GESIS guideline on nonresponse bias explains that bias can be related to differences between participants and non-participants. A high response rate therefore does not, by itself, guarantee an unbiased picture. Keep these limitations visible when presenting results.
When can we compare two points in time?
Review the wording, scale, reference period, group invited and how the survey was conducted. If a question concerns the past week in the first round and the entire quarter in the second, comparability is limited. A change in team composition can also help explain a development.
Note important events: a new manager, a major assignment, a reorganisation or a holiday period. Information like this is part of interpreting the results. It should not be brought in retrospectively only when you dislike the outcome.
Still change an unsuitable question when necessary. Then mark the start of a new comparison series. A methodologically questionable trend does not improve by continuing it for as long as possible. For demanding scientific or diagnostic goals, you also need specialist expertise and an instrument suited to that purpose.
How do we turn results into a decision?
First choose a finding that fits your original decision-making purpose. Describe it without rushing to a cause: ‘Feedback on priority clarity is lower than before.’ Add how many responses are available and which contextual changes are known.
Then explore an explanation with those involved. Only then does an action follow. If you introduce a new priorities meeting, for example, document whether it actually takes place and whether unresolved conflicts between objectives are addressed. Then repeat the appropriate question and consider the trend together with this information.
The guide Analysing an employee survey takes this step further. The article Improving employee satisfaction provides a broader view of influencing factors and actions.
Before choosing a tool, name the analyses you need. Is a trend for the same team sufficient, or do you need a different method justified by specialist considerations? Do response distributions need to be visible? Who may see them? What information is actually needed for a decision? These questions help prevent equating features with insight. An elaborate report does not automatically become more useful if the original decision-making purpose remains unclear. Conversely, a simple presentation may be sufficient if the question, responsibility and next step are clearly defined. Review the specific process in a demonstration before inferring suitability from a feature list.
How should EngageBeat be understood in this context?
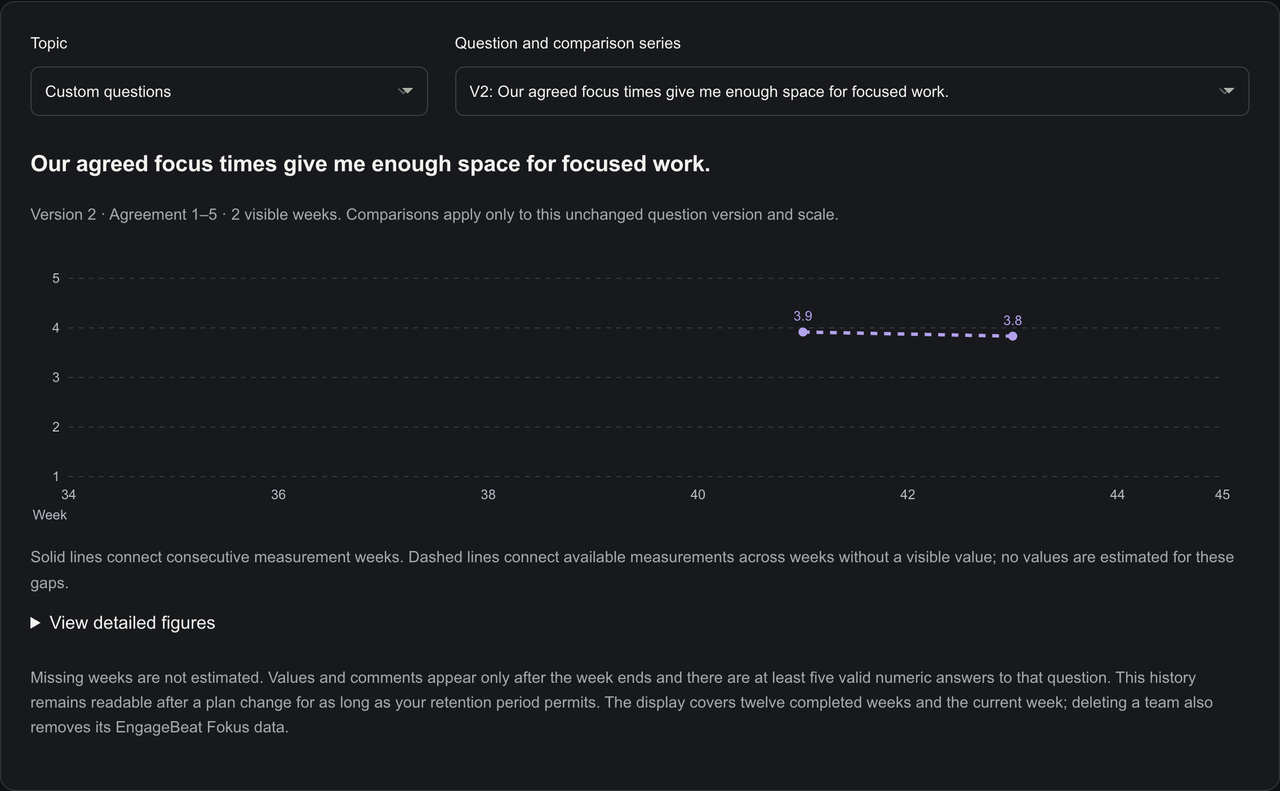
EngageBeat offers short weekly check-ins and separate topic trends. The fixed team index refers to a consistent question and is not a scientifically validated satisfaction score. EngageBeat Fokus adds your own questions. How it works, confidentiality and the trial help you assess it. After 28 free days, your chosen subscription begins unless you cancel in time.
What common questions are there about measurement?
Is a scale from one to five always the best choice?
No. The format must fit the subject, target group and purpose of the comparison. Clear labels and consistent use matter.
How often should we measure employee satisfaction?
As often as is useful for your decision and you can address the feedback. Short recurring check-ins and a comprehensive assessment have different purposes.
Does a better score prove that our action is working?
It may be consistent with the action, but does not establish a causal connection on its own. Review implementation, other changes and relevant information from everyday work.
Sources and further background
Try it in your team
Try recurring team questions with EngageBeat without equating them with a comprehensive satisfaction assessment.
Try free for 28 days — with up to three teams. Can be ended at any time during the trial.
All terms